

Audit Log
The audit log records every significant operation on the platform: VM creation, network changes, member management, agent updates, and more. It provides a searchable history of who did what, when, and where.
View the system audit log
Navigate to Platform > Audit Log in the portal. The audit log displays all operations in a filterable table view.
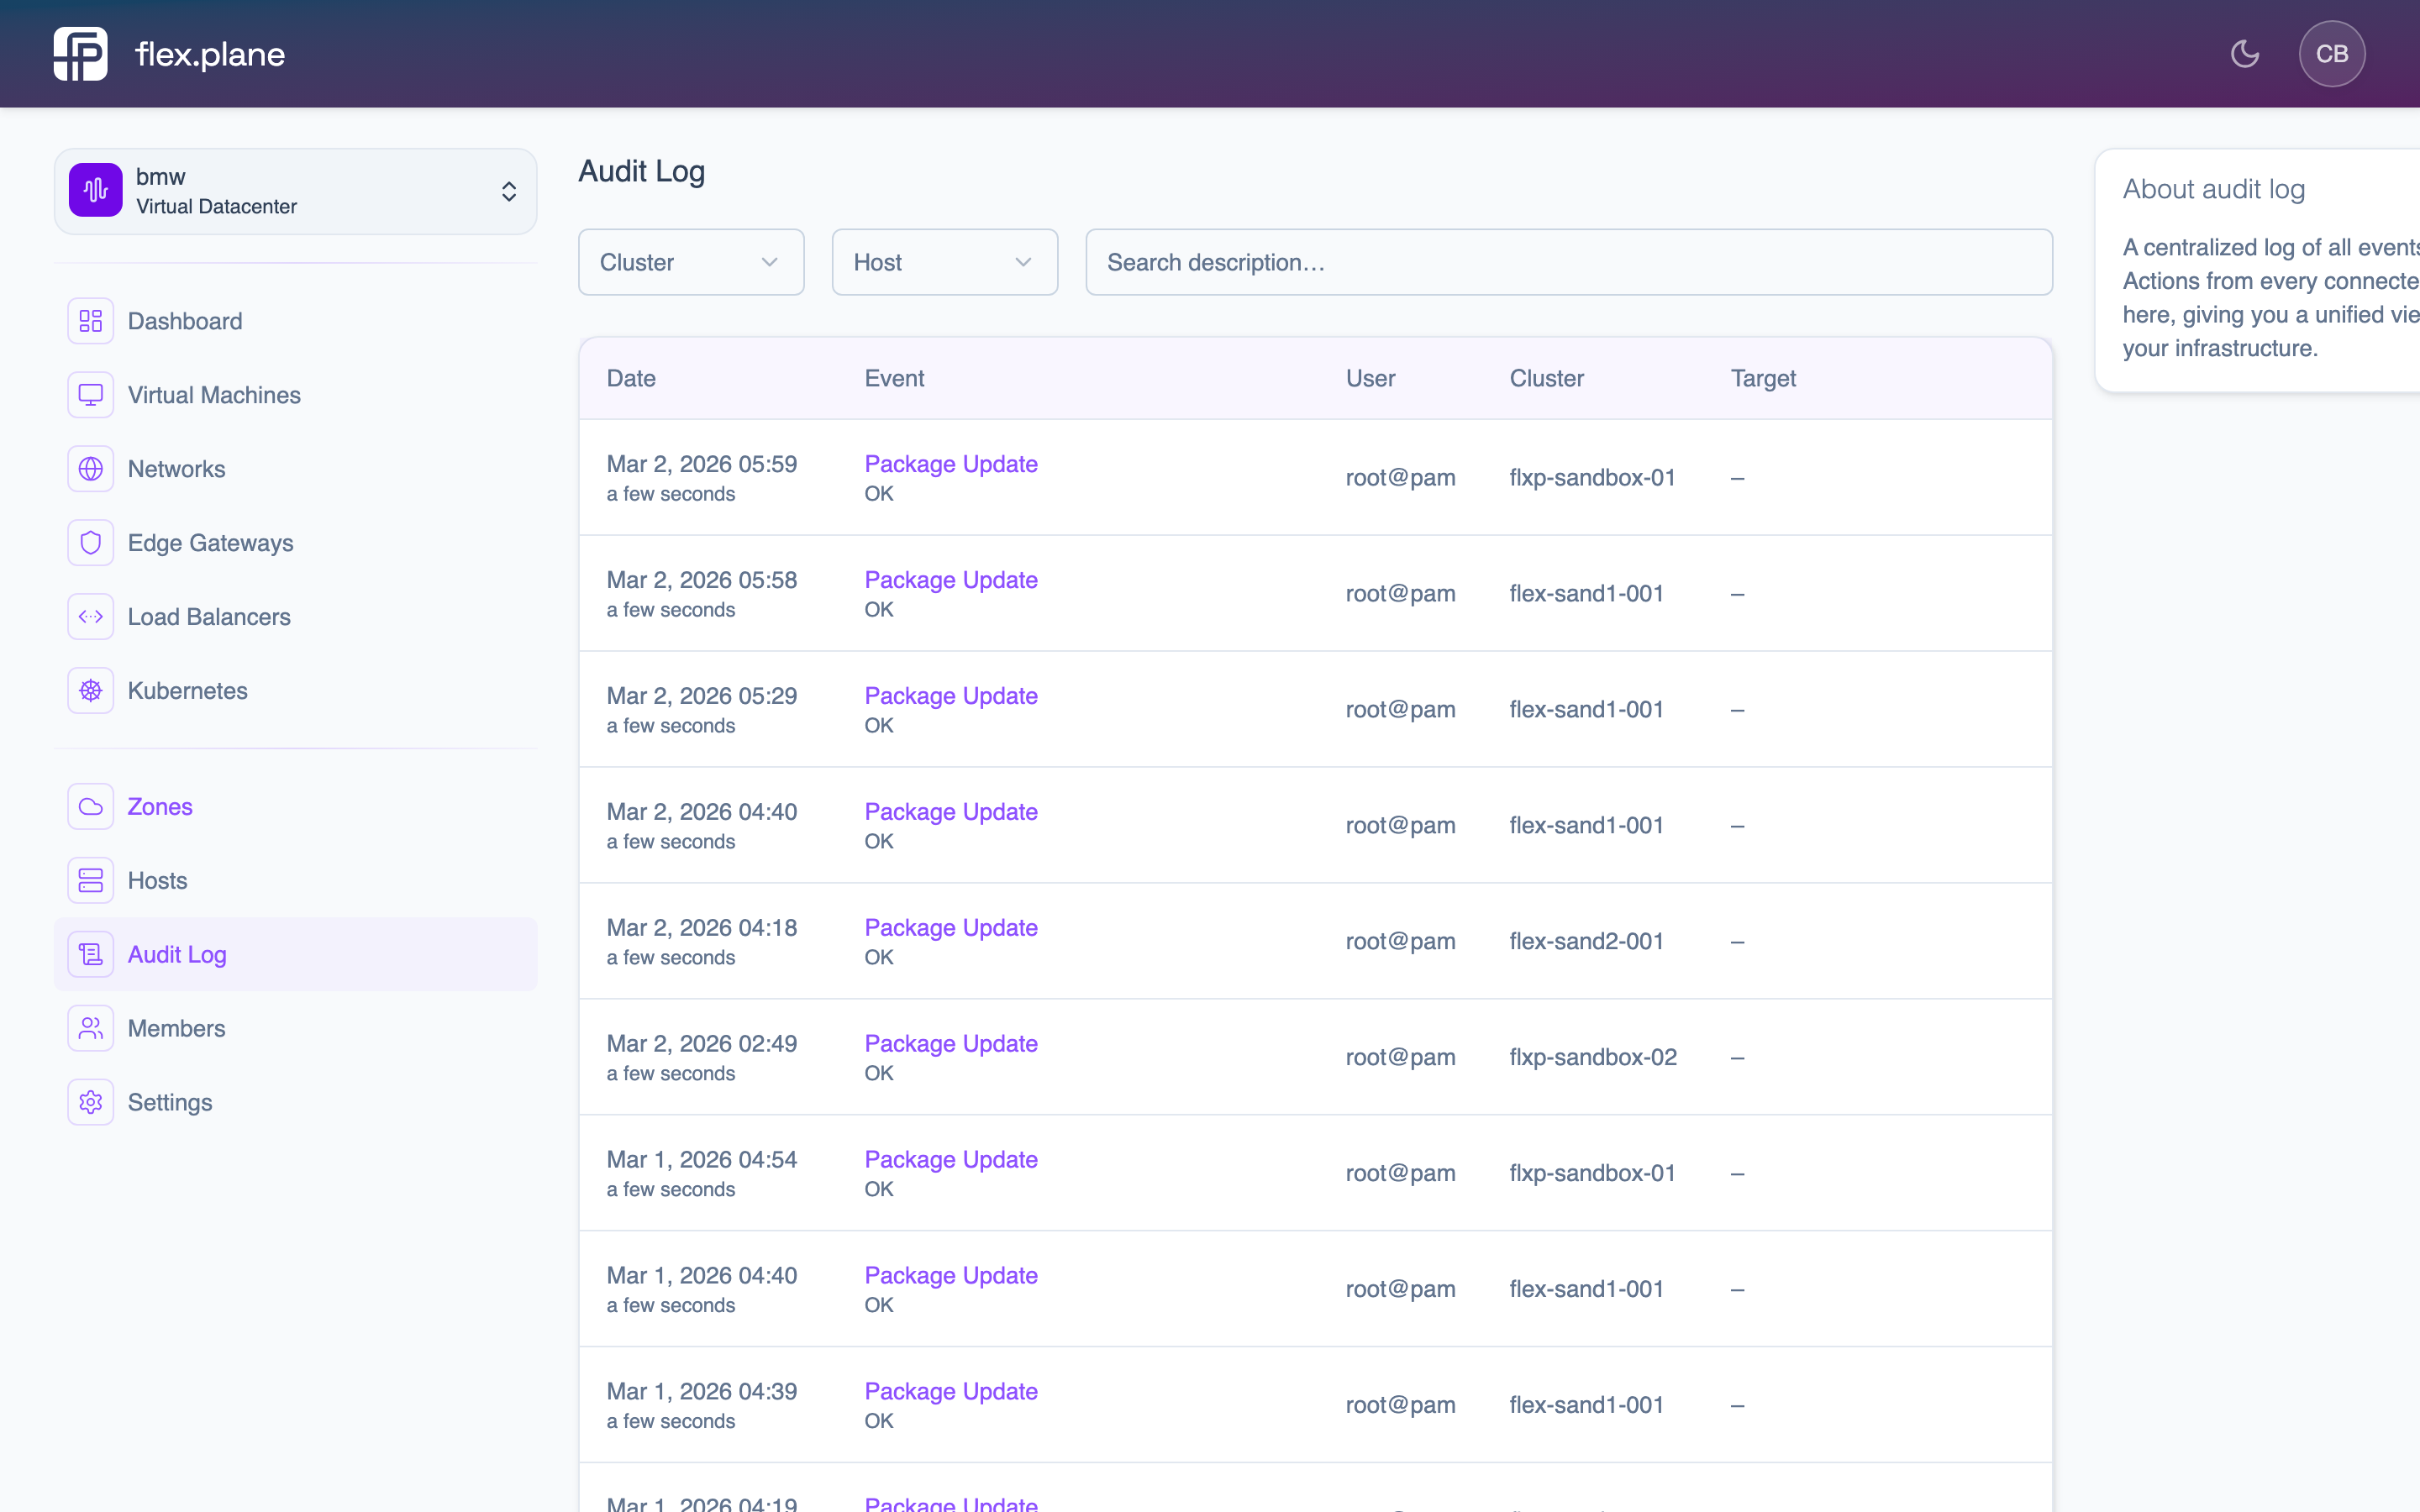 The Audit Log page lists all operations with their description, status, user, timestamps, and affected zone.
Each audit event contains:
| Field | Description |
|---|---|
id | Unique event identifier. |
description | Human-readable description of what happened (e.g., "Created VM web-01"). |
status | Outcome of the operation (e.g., OK, Error). |
user | The user who triggered the operation. |
start | When the operation began. |
end | When the operation completed. |
target | The resource affected (VM ID, network ID, etc.). May be null for system-level events. |
zone | The zone where the operation executed. |
Filter by resource
The audit log supports filtering by zone, host, or VM to narrow down events:
- Filter by zone to see all operations in a specific Proxmox cluster.
- Filter by host to see all operations on a specific node.
- Filter by VM to see the complete lifecycle of a specific virtual machine.
Understand audit events
Audit events are generated by Proxmox task logs and collected by the orchestrator at query time. Since flex.plane is stateless, the audit log is derived from Proxmox. It is not stored separately.
Common event types you will see:
| Event | Description |
|---|---|
| VM create | A virtual machine was provisioned. |
| VM start/stop/restart | Power state changes. |
| VM delete | A virtual machine was removed. |
| VM migrate | A VM was moved between hosts. |
| Disk resize | A VM's disk was expanded. |
| Backup create/restore | Backup operations. |
| Image download | An OS image was fetched to a node. |
The status field tells you whether the operation succeeded or failed. Failed operations include error details in the description field.