

Virtual Machines
VM Metrics
Monitor CPU, memory, disk, and network usage.
flex.plane provides both real-time resource usage and historical metrics for every VM. Use these to monitor performance, identify bottlenecks, and plan capacity.
View current resource usage
The VM detail page shows current resource consumption at a glance, including CPU, memory, disk, and network metrics.
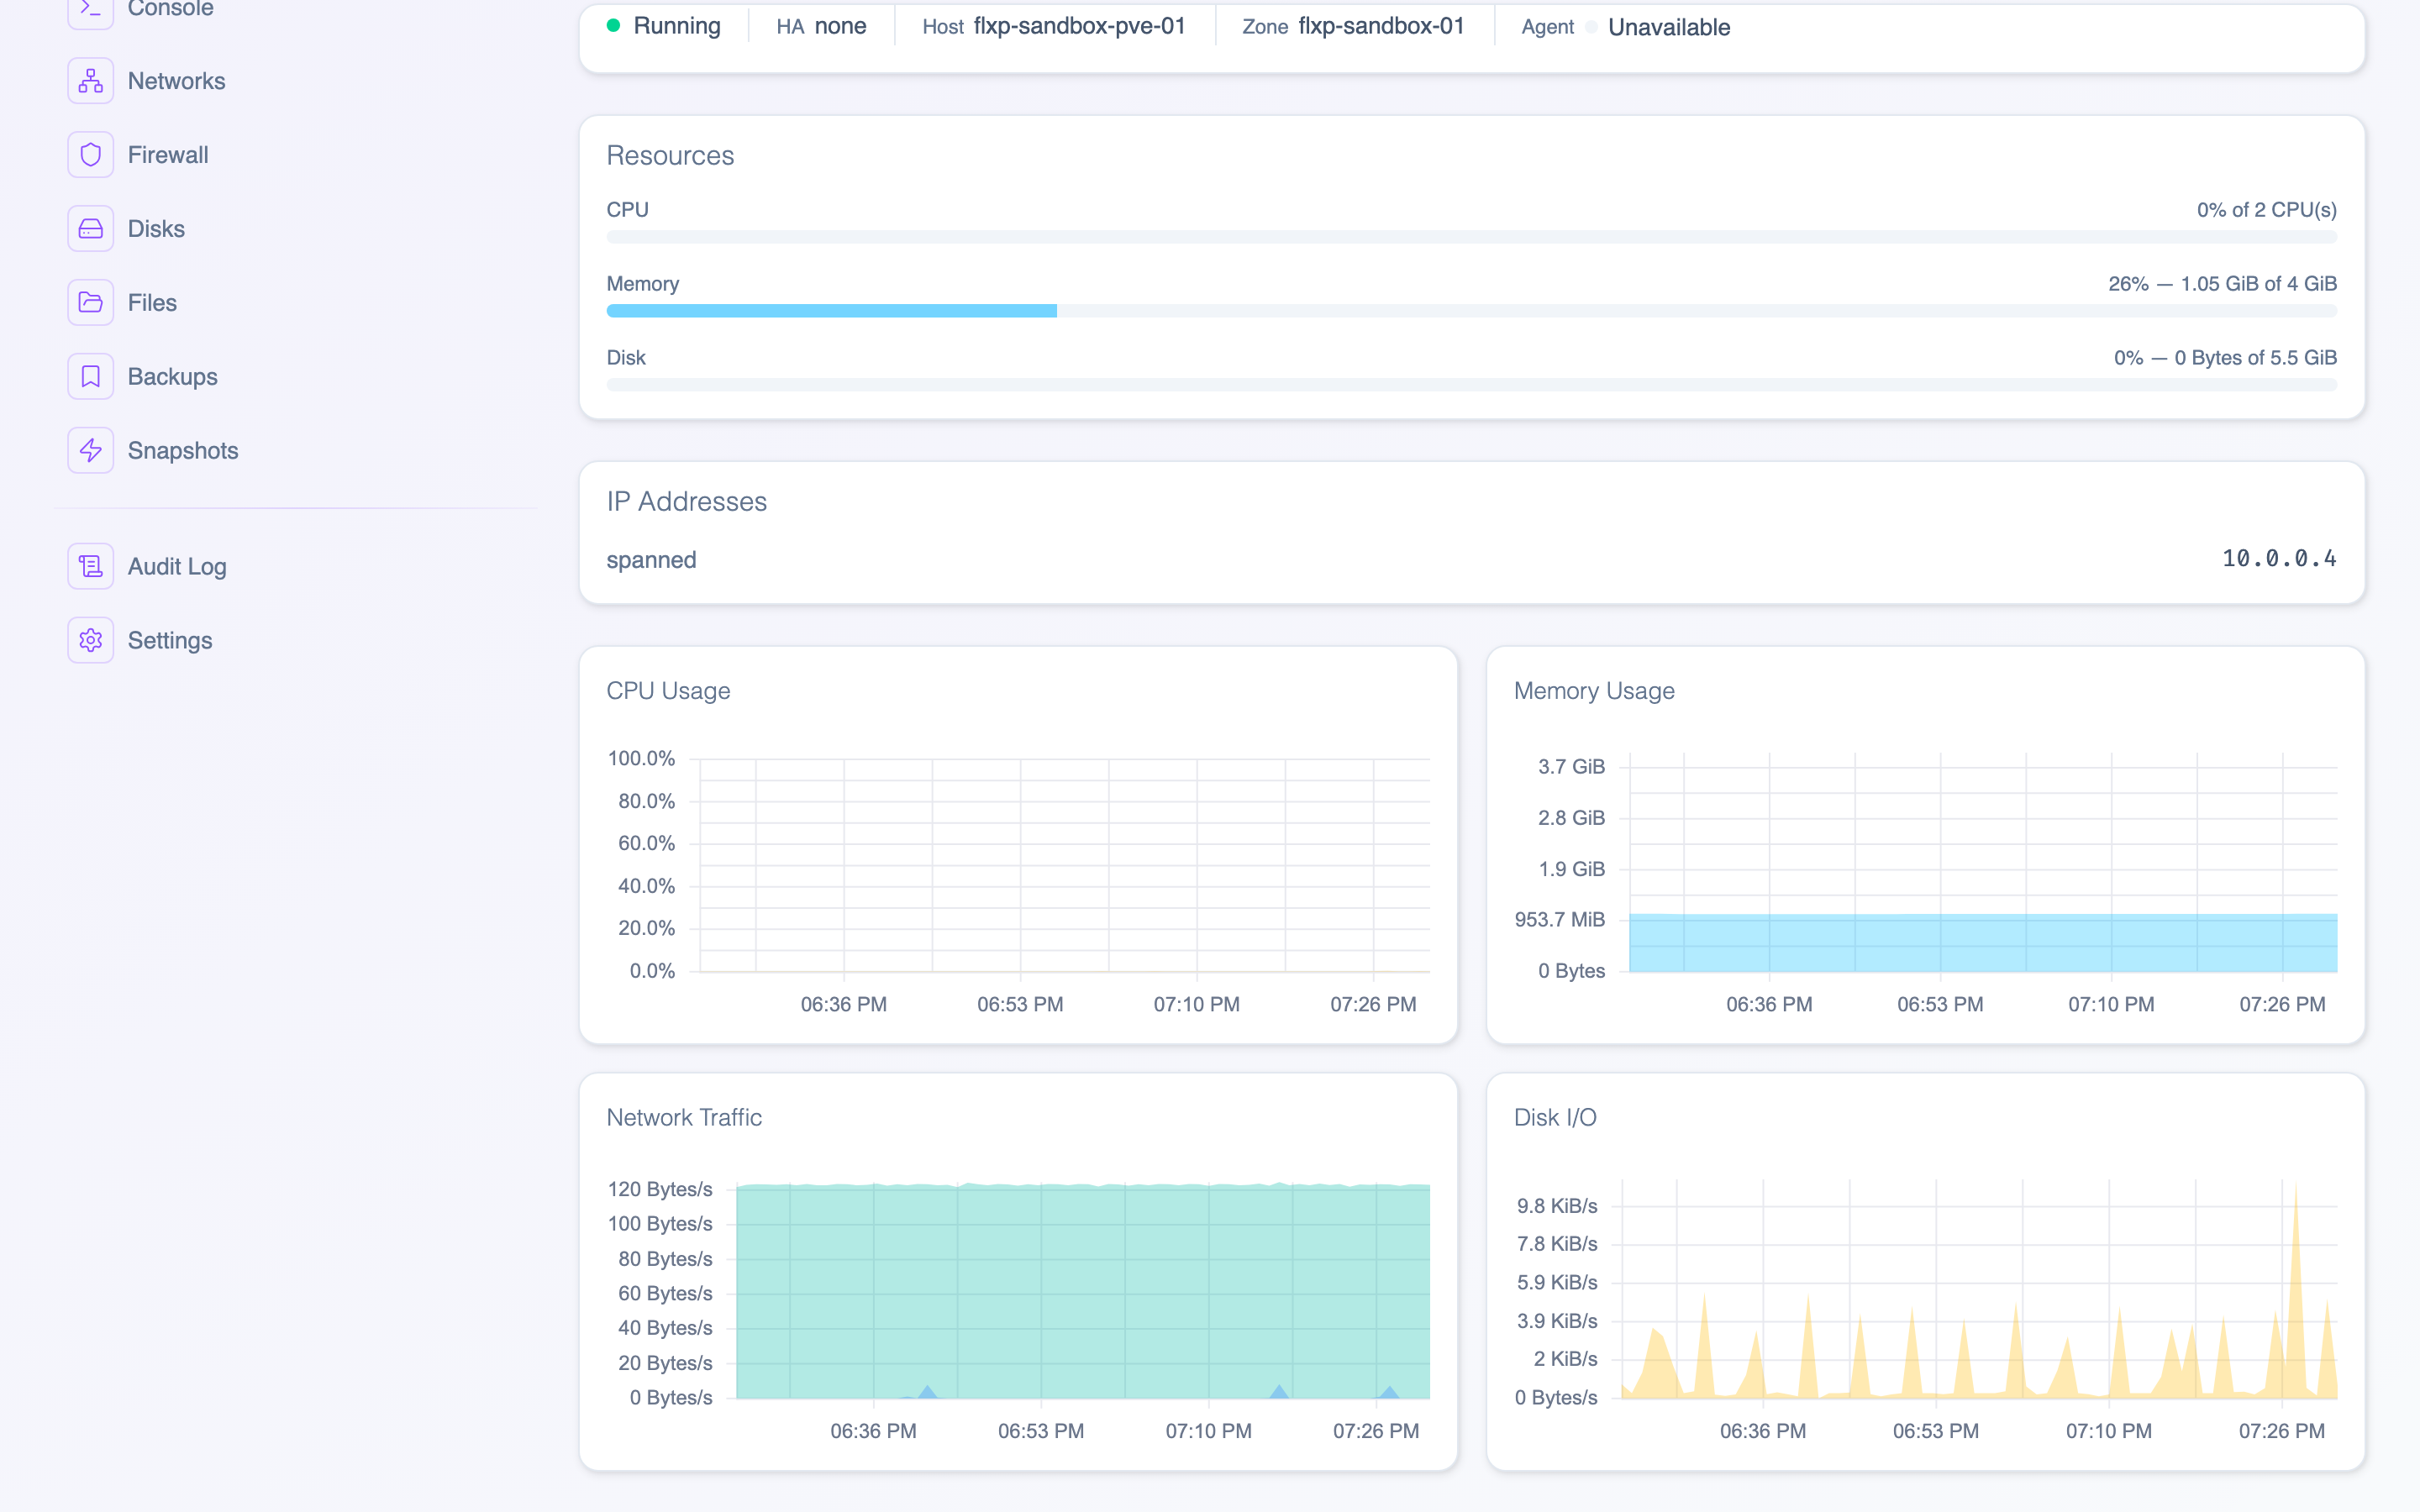 The VM detail page displays real-time resource usage including CPU utilization, memory consumption, disk I/O, and network throughput.
Available metrics:
| Metric | Description |
|---|---|
| CPU utilization | Current CPU usage as a percentage of allocated cores |
| Memory usage | Memory currently in use vs. total allocated |
| Disk usage | Disk space used and available |
| Disk I/O | Total bytes read and written since boot |
| Network I/O | Total bytes received and sent since boot |
Current resource usage is fetched directly from Proxmox in real time. There is no delay or aggregation. You see what the hypervisor reports right now.
View historical metrics
The VM detail page also shows historical metrics for trend analysis. You can select different timeframes to view usage patterns over time:
| Timeframe | Period | Use case |
|---|---|---|
| Hour | Last hour | Debugging current issues |
| Day | Last 24 hours | Daily usage patterns |
| Week | Last 7 days | Weekly trends |
| Month | Last 30 days | Capacity planning |
| Year | Last 12 months | Long-term growth analysis |
Each data point includes CPU, memory, network, and disk I/O metrics plotted over time.
Historical metrics are great for identifying patterns. If your VM's CPU consistently spikes at the same time every day, it might be a cron job or scheduled task that could be optimized, or a signal that you need a larger compute profile.
Metrics are sourced from Proxmox's built-in RRD (round-robin database). Longer timeframes have lower resolution. Hourly data has more granular data points than yearly data.